|
Back in the 2000s, I had quite a few of my letters to the editor printed in the Guardian (note, one of three national papers I tend to read). The latest is on set texts for GCSE English, and a bit of fun.
It did remind me to look at some of the older letters. The first one is an example of a long-term theme of mine, in that it's the misuse of numbers to make impossible or nearly impossible claims. This one, I maintain, did stop the government making claims that the average graduate would earn £400k more than the average non-graduate.
0 Comments
Now we've had the first two events, I've just a little reflection to be posted here, and one about the effect of COVID on this. It's because I looked over the plans we had for 2020, and then thinking about what it was instead!
The first year we did this (2019), it was basically an excuse for me to show Do the Right Thing, 30 years after release. I don't think I showed the photo of 16 year old me with Public Enemy, from about the same time. We also showed Mona Lisa, The Purge and The Harder they Come. I must note that there's a 35 year time frame from Cathy Tyson being in Mona Lisa, and now in the brilliant Help. In 2020, we were all set to show I Believe in You, American Psycho, Shoplifters (student choice), Hot Fuzz, Twelve Angry Men, Le Trou, La Isla Minima, In the Name of the Father and a Rex Bloomstein double with a retrospective and A Second Chance. It would have been brilliant, and then we were told to cancel it all: no-one was allowed in the buildings or in the cinema spaces. Instead, we switched to an online format, and we're showing documentaries and films made in prison by people in prison. Rex Bloomstein was back last year with the retrospective, Crime and the Camera, and we've also worked with Koestler Arts to show a number of prize-winning pieces. This year, we have Bloomstein's A Second Chance, some Koestler winners, Gun No. 6, and Incels. I'd love to go back to having the cinema space, and an audience sitting for 90 minutes before we discuss the issues raised. This post-COVID arrangement, though, does mean we can show clips, and host conversations, and people from all over the world can join, not just those in Manchester on a Tuesday evening after work. Hopefully next year we'll be able to do both. 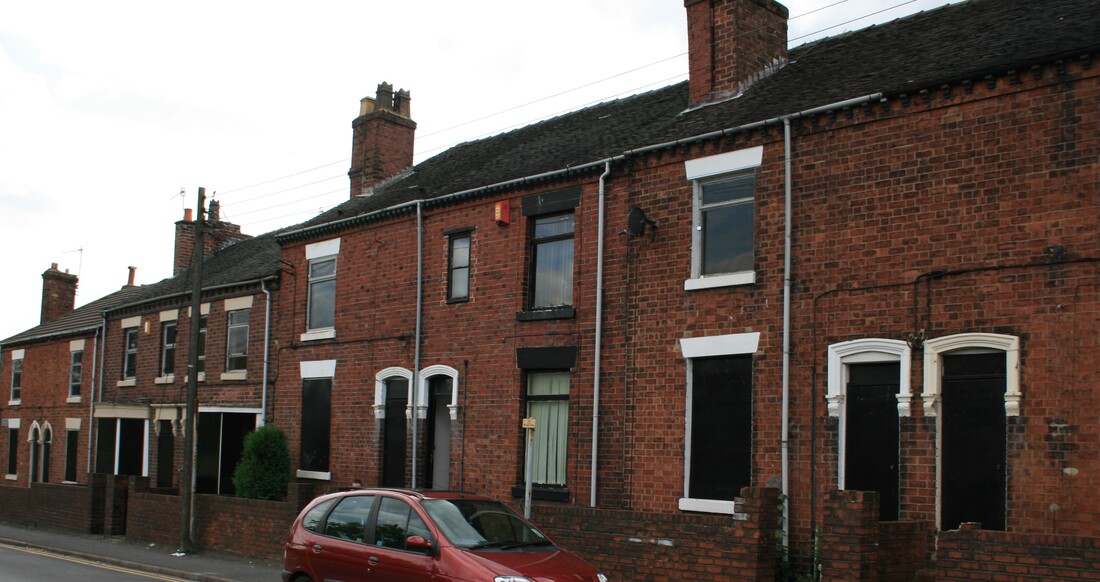 When our house was the last one still occupied, and the rest of the street was 'tinned up' to prevent scavengers. ‘Answering at last the plea of the forgotten people and the left-behind towns by physically and literally renewing the ties that bind us together so that with safer streets and better education and fantastic new road and rail infrastructure and full-fibre broadband, we level up across Britain with higher wages, and a higher living wage, and higher productivity’ (Johnson 2019).
Now that Brexit is done, and the British government is free – or rather cannot blame anything on the EU – it’s time to take them at their word on ‘levelling up’. Forgive me if I sound jaded, but having grown up in one of those places – in the one percent most deprived postcodes in England in 2015 – and occasionally going back to the council estate my mum lives in, I know ‘spreading opportunity’ isn’t going to be easy. Indeed, it’s been tried before, again and again and again. When I worked in a DCLG/ Home Office quango, I found paperwork from the late 1960s where the same estates were having the same kinds of projects as were described as ‘interventions’ in the 2000s. First, there’s lots of housing to be repaired, upgraded, replaced. Homes are cheap in Stoke, but often for a reason. At one point, a quarter of all the council homes with ‘category one hazards’ in England were in the city, and there are plenty of unfit private sector homes too. When I was at secondary school, my mum and her husband, and three children, lived in a two up, two down terrace, opposite a derelict coal mine, whose workers the houses were built for. My room was a converted kitchen, with damp walls (and so many of my childhood belongings didn’t survive). I had nowhere to do homework, my social life was in the street. If Troubled Families had existed, we may well have been on the referral list, although I will not reveal which were the case from the qualifying list (‘out of work benefits’, ‘children who are regularly truanting or not in school’, ‘youth crime or anti-social behaviour’ and ‘high costs to the taxpayer’). The house was demolished in a slum clearance programme as it was beyond repair: my brother was rehoused by the council eventually. To be fair, the neighbourhood had its ups and downs, and was never considered the worst (see http://www.thepotteries.org/another/003.htm). One of my parents grew up in one of the council estates with the worst reputation, the other on another, more respectable, council estate. The 1980s and 1990s was a downhill period for the neighbourhood I grew up on, however. Those who could, moved away. In the 1990s and 2000s, houses were bought as buy to let, and then these private rentals were where local authorities placed those who could not be placed in the sold-off social housing. As the social fabric decayed, the facilities began to close too: the working men’s club was destroyed in an arson attack, as was the pub. Another nearby pub has closed under the Covid-19 lockdown. The sports fields were closed, as well as the fish and chip shop, newsagents, and more. Knocking down whole streets did mean eventual rebuilding of better housing, albeit more expensive than what was there before. The decline also meant a fair bit of crime and disorder: burglaries mainly, and usually perpetrated by those local, although a friend was glassed as part of a street fight outside the working men’s club. If a boy from this street went to the local school*, they probably wouldn’t do well. In 2017, 78% of the year 11 boys at this school failed to get 5 or above in maths and English, whereas at the comprehensive near to where I lived in London, this figure was 35%. Unlike schools in other parts of the country, those in Stoke do not have 6th forms attached, so to do A-levels requires a five and half mile journey to the college. Somehow this takes 45 minutes to an hour by public transport, and costs £56 per month, unlike in London where school children and 6th formers get free transport. While I was doing my A-levels, I did have a job, as a picker in a warehouse about 5 miles away again. By public transport, this journey would now take 90 minutes. At the minimum wage, this would pay my equivalent in 2020 a total of £18.20 for a four-hour shift, although getting there and back adds another three hours. Most of the time, I was able to get a lift there and back. I didn’t need to work when I became an undergraduate student, however: I was lucky to have fees paid by the local authority, and a maintenance grant that covered all my outgoings. To tell the truth, working as an undergraduate wasn’t allowed by the university. Finally, we get to that regional jobs market and policy. Simply, I had to move to London to get anywhere near the kind of work I wanted: Stoke had and still has low-skilled, low-wage jobs, and enough unemployed people to make it stay that way. When I left university, I had less than £10 to my name. No inheritances or other financial help could come my way, obviously, so I could neither stay at my mum’s house, or afford anywhere else. I sofa surfed, like so many do, until I could afford rent. Indeed, every Christmas I’ve seen 20, 30, 40-something friends talking of ‘going home’, that is, taking themselves, their partner and maybe their kids to stay with the parents/ grandparents: I’ve never done that, as the ex-council house my mum lives in has no spare room. Thus, opportunity is hugely structured by these regional as well as individual inequalities. Parents with money can invest in their children’s futures, lending them some to get a foothold in the big city. Families living in big cities can provide a base for their children to do a first job or an internship. This continues later in life too: the long-term wage inequalities mean those who have earned enough to buy a home in somewhere like Stoke can never sell up and move to London to take up a new job. The houses in the street I grew up in were compulsory purchased for £55k each in the late 2000s, when the UK average was around £175k. Even the new, better built, houses are valued at only £100k now, the equivalent of a third of a one-bed flat in London.** At least now the low paid jobs are less likely to kill people, however. One of the long-term consequences of industrial economies is a whole load of older people with work-related health problems. For the generation before, my grandparents’, it usually meant paying in for pensions that were never cashed in, as they died before 65, after some time off work for ill health. Pottery workers suffer from silicosis and deafness. While the health budgets are higher (per head) to reflect this, it also means a long-term lower total income for the city, as there are still plenty who are economically inactive before their time. How, then, can ‘levelling up’ make an impact on inequalities that are decades or centuries in the making? The government seems to suggest that revitalising economies will be enough, with new businesses providing some better paid job opportunities. This isn’t going to move any traditional industries from one city to another, however. It won’t do anything about schools, local communities and infrastructures, wealth and assets, health or cultures. Shifting huge amounts of funding to education systems, re-building public transport, increasing the minimum wage, funding local authorities, providing financial resources to those at the bottom is all needed. Moving government departments will start a process, but this kind of levelling up will require decades of unravelling deep inequalities. It will mean the government’s core support will be worse off in the long run, as there’s no way that everyone can be in the top half of the income scale. I’m willing to wager it doesn’t really happen. *Luckily, I didn’t. At the time, there was a scheme to send those who did well in entrance exams, but with low incomes, to fee-paying schools. My mum, who left school at 16 but went to the Open University after having children, pushed me educationally, and by the time I was 12 she became a maths teacher at the same place. My class position at that time is best described as ‘uncertain’: by some measures, I’d definitely be working class, and middle class by others, but in a working-class family. As an adult, I’m definitely middle class, while my parents are not. **It’s also completely bizarre that the band A council tax bill for a £80k house on a council estate in Stoke is the same as the bill for a £350k band B rated flat in Kensington and Chelsea. I’ve done a reasonable amount of the lockdown socialising over the last few weeks: emailing people I haven’t been in touch with for a while, calls with family and friends, a couple of Zoom birthday parties. In the latter, there have been both verbal and visual of the realities of being stuck in the house. We see the inside of kitchens and living rooms, and we talk of how glad we are to have a garden, a bit of space. Children come in and out of shot, doing their thing, and where grown adults have ended up back at their parents, they are sat in spacious conservatories or kitchens. Lockdown isn’t too bad if you have room. Both Coronavirus and the response is deeply regressive. At work, those at the bottom of the pile are more likely to have to continue going out to work, delivering, emptying bins, driving buses, staffing shops; the managers are working from home because they can. Up to the median earnings, the more people earned before, the more resource the government will use to help them. Many at the bottom have been made redundant, with income dropping to the minimum benefits levels. Even the US has a more progressive system here. In the long-term, the lockdown’s effect on the economy will cause more job losses, again disproportionately for those in the lowest paid sectors (think waiters, cinema attendants and so on). We already know that being poor, or black means your more likely to get seriously ill or die. Children’s education will suffer, but the poorest kids will suffer the most. Those working from home with space and facilities will be more productive than those without. The post-lockdown ideas on transport will also reproduce these inequalities. Where I lived as a young person, and where my family are from and still are, represent examples of this (even though they are by no means the worst). In my 20s, after a period of sofa surfing, I got a foothold in London in a ‘house in multiple occupation’ in Leytonstone. This was a bottom-floor, kind of a flat but not, consisting of a living room, a bedroom, and a fragile lean-to built onto the back with a sink and cooker: the bathroom was upstairs, shared with two other households. Two of us were in the bedroom, and for a time two more in the living room, and all had to walk through the bedroom to get to the ‘kitchen’. Neither social distancing nor working from home would be in any way practical in this.  As a teenager in the 1980s and 90s it was little better. The house I grew up in (above, just before it was knocked down as part of the 2000s slum clearance programmes) was a 60 square meter or so terrace opposite a derelict mine: even in the 1990s and 2000s houses could be bought there for less than £10k. There were five of us, and sometimes seven, and at first all the children shared one room. Smaller bedrooms were created by splitting one of the two upstairs bedrooms and converting what would have been the small back kitchen into a bedroom, while the kitchen was now in the living room. My room had room for a bed, but no desk or wardrobe. I didn’t have a space for doing homework, and all three children couldn’t have done homework in the kitchen at the same time: we didn’t have a dining room or dining table, but a breakfast bar style section that could seat 3 or 4 to eat. In fact, I never did homework at home, but did it at school before the main day started. We didn’t have a garden, and most socialising was done on street corners: I would be one of those described now as ‘feral youths’, who are now being policed for lockdown offences. 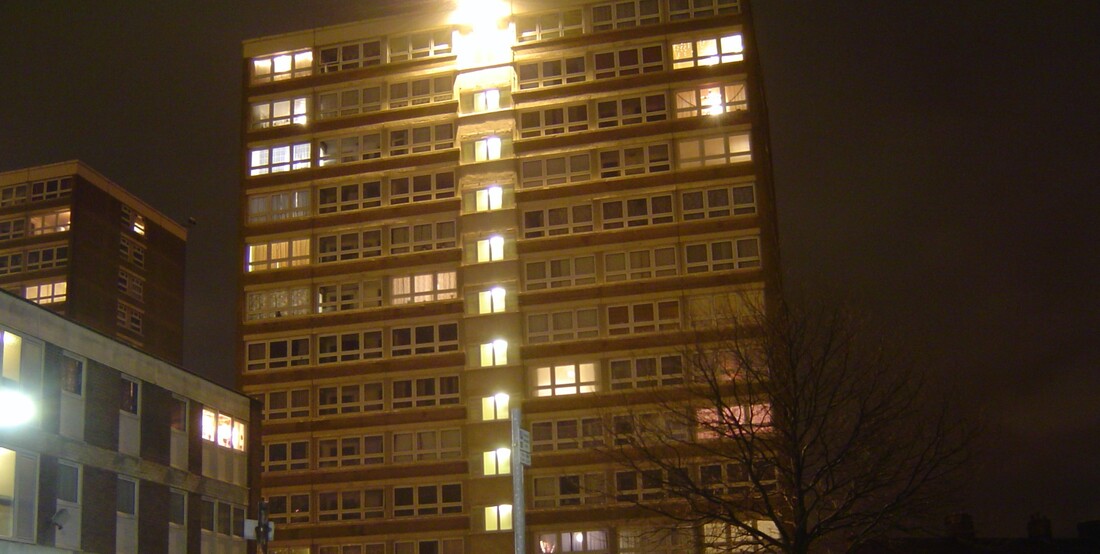 At the same time, my grandparents were in another example of poor housing unsuitable for lockdown. After working their whole lives in the pottery industry, they were in a council flat on the 10th floor of a tower block, with no access to green space at all. Indeed, photos of this block are now used to show the problems of inner-city Britain (see the Guardian), and are now where the council houses refugees and asylum seekers. Weirdly, some of the photo agencies have photos of these blocks as being ‘built to accommodate the local housing crisis and to fulfil the social housing requirement’ or representing ‘the increasing population, housing crisis and over crowding [and] immigration’, as though these new poor migrants were the first to find themselves in this unsuitable accommodation.
For both adults and children, then, the effects of the lockdown will hit hardest on the poorest. There is a digital divide: some have the kit at home to work or learn from home, and some don’t. Some children will have home schooling with parents that have lots of time and energy, but some will be home alone every day. Some have space, and some are trapped in tiny homes in abusive relationships. A fairer lockdown would take all this into account. P.S. And so on it goes, with the new plans (10 May) that those in factories and so on should go back to work, while those who can work at home should stay at home. This appears to suggest even more of the poorest people required to go out, while middle-class people continue to work at home. What happens to their children isn’t answered: are we to assume that they can be left at home unsupervised? At what age, and what about other safeguarding issues? From the very beginning, it has not been clear what employers will do if they need staff in, but those workers are stuck at home because the schools are shut. The employee can ask to be furloughed, but the employer doesn’t have to offer this, and can offer unpaid leave instead (see Working Families). For this to be done safely and fairly, the home conditions described above will have to be taken into account: leaving a child at home to be schooled by a nanny, or a teenager alone in a suburban semi to get on with school work is one thing, leaving a teenager alone in a tower block or sink estate is another entirely. Will any of those making the decisions care to swap places? My current work is on child migrants and integration. While I’m uncomfortable with some of the terminology (especially integration), there are interesting things to be said. Here, though, I want to make a ‘signal and the noise’ argument about the way that religion or other ideas of ‘cultures’ isn’t always the most important thing going on.
I go back a few years here, to the arrival of two migrant families in my street. Both were in the UK for education of a male adult, and both had kids. One family was from a place that was once part of the British Empire, where English is an official language. The other was from the middle East, with Arabic as the home language, and the family had enough adherence to religiosity and cultural norms that the dad was a regular mosque attender and the mum stuck to Arabic attire. Further, the mum didn’t speak a word of English. On paper, the former would have been a far safer bet for integration into the local community. In the end, the opposite was true, so what else was going on? I’d argue two things were key here, life-stage and personality. The first family had their first child not long after arrival, and were staying in. There may have been some engagement with parenting groups, but they kept themselves to themselves. The second family, however, already had two kids in nursery and key stage 1 age. This meant that the parents were doing the school runs, and having to engage with their kids’ integration. So as the children made friends, and learned English organically, the mum ended up learning some English too. Being outgoing, she also was chatty to other parents, even when her English was at its most basic, and was apologetic for this. She quickly made friends too, and the whole family were regular visitors to other homes on the block. When the two families left to return home the difference could not have been more stark. The first family moved out without fanfare. The second family had multiple leaving parties, at their home and others, with much food shared. Contextual admissions and football transfers: or ‘past performance is no guarantee of the future’5/20/2019 I’ve used the football transfer analogy before in a university context, critiquing the previous REF’s system of rewarding universities for work their staff have done in the past, even if done for another institution. While that was a bit contrived, the analogy is certainly right for contextual admissions – basing university entrance on more than A-level results – where potential is a key factor in deciding who gets a particular opportunity.
First, a disclaimer. Despite growing up in one of those places visited by sociologists when they want to examine urban despair, and being the only person in my family to not leave school at the earliest opportunity, I did go to an elite university, and before that an ex-grammar fee-paying school, both times on a government-funded scholarship. I do wonder if some form of contextual admissions happened then, via the interview and other means. Anyhow, I digress. Last week the head of Stowe school called foul of contextual admissions, complaining that taking background into account, and so perhaps having lower entry-grade requirements for those going to less good schools, was social engineering and discriminating against his richer clientele. Notwithstanding the fact that public schools are the most obvious form of social engineering the UK has, the teacher seems to have forgotten that organisations are (mostly) free to work out their own criteria for maximising their impact. I assume, like most employers, that he doesn’t recruit his staff solely on the basis of their exam results. The football recruitment market is a fine example for thinking about this, because it’s in the public eye with a degree of transparency. There aren’t many industries where we know who has been taken on, what their wages will be, where they worked before and what their past achievements look like. And accredited past achievements are part of, but by all means not the whole of, what a scout or manager would think about… because it’s the short to medium-term future of the club that are important. Most obviously, a club isn’t going to recruit on only how many world cup winner’s medals a player has. They might be about to retire, and the most famous players cost more anyway. It’s also teams that win trophies, not individuals. An amazing player in a less good team will win less than a good player in an amazing team: sounds like what we could say about kids with good A-levels after going to an average comprehensive. Alongside this, we should always note that how good a player looks now relates to the team and opposition: getting the best crosses does wonders for goals from inside the area. But a player’s skill now is a result of their training. A player not picked up for the premiership at a young age – often because they were small – will be training with lower league coaches, will spend less time training and so on. But if, at 18, they look streets ahead of the other players in the league, then a scout could see potential for great talent, once the right training is in place. Finally, we have the question of fit. Does the player’s style or potential style (after more training) fit with the team’s style of play? What of their personality, and will it clash with other players or staff? And, most obviously, is there a space at that position, now or in the near future? If A-levels (or formal qualifications generally) were the only way to make a judgement for recruitment, shouldn’t this be the case more widely. I’m willing to bet that I got better A-level results than the Stowe headmaster, and I look forward to him stepping aside for me to take the position. One difference between myself and my more privileged friends and colleagues is the ability to go back to a childhood bedroom or equivalent. Following work on intergenerational mobility, the role of the family in social mobility and home ownership and social mobility, I use this as jump off point to think about the role of assets or Bourdieu’s capitals and the way such resources help people to get even more ahead. My own childhood bedroom is long-gone. I was a teenager in the 80s, and lived a few hundred metres from the council estates my parents grew up on. I won’t go into the wider disorder and split life of my childhood – that can wait for another time – but I’m relatively sure that I was one of very few Cambridge students to return, after graduation, to a miner’s terrace on a sink estate, which had already been scheduled for demolition as part of Stoke-on-Trent’s slum clearances. A few years later it was demolished, after decades of social decline: I returned for an hour or so to watch my childhood room be destroyed. 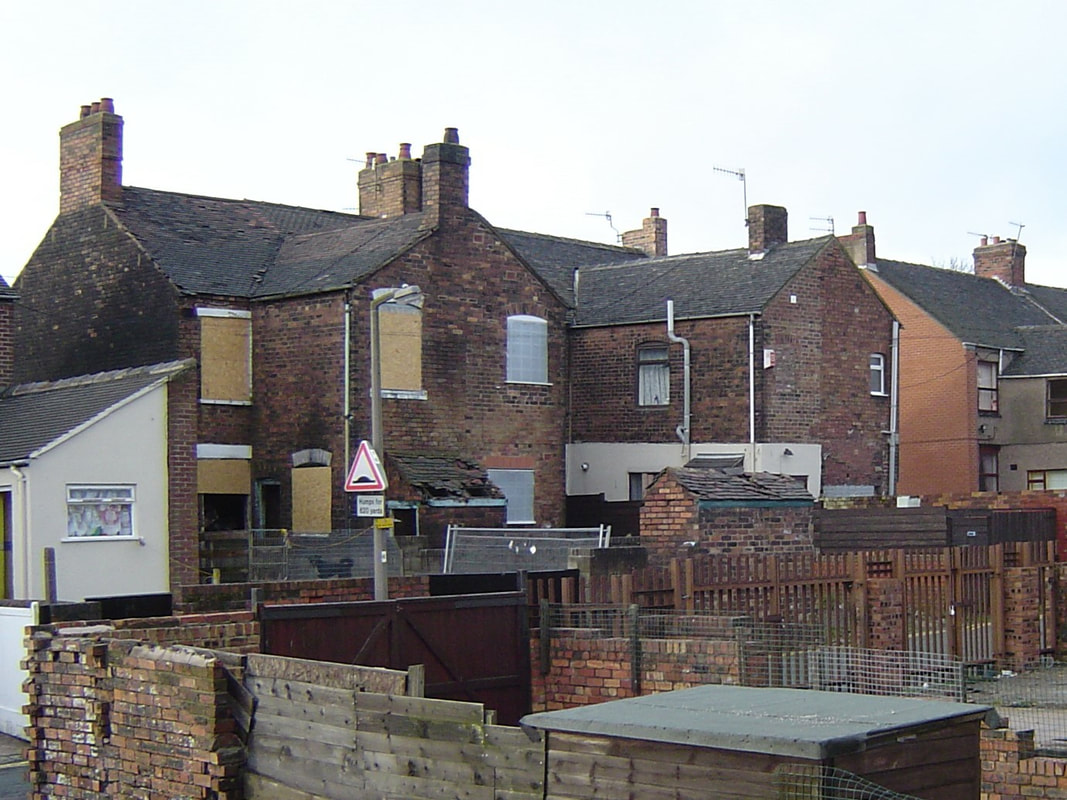 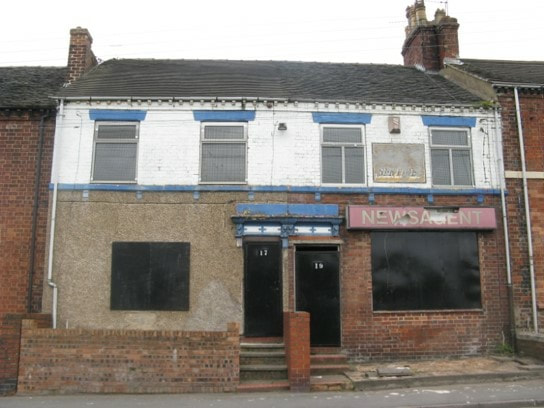 This kind of environment is one where teenagers have to live their social lives on the street, in bus shelters, working mens’ clubs and sitting on garage roofs: I learnt later that others had friends round to visit. I didn’t realise at the time, but it is unbelievably disheartening to have tasted privilege and then have to return to this. A few months later I fled for good, and two decades later I can count the number of hours I’ve spent in my mum’s current house, on the council estate at the end of this same street, on one hand.
And this, then, is where the first of those asset issues arises. I’ve been lucky with my education, timing wise, as the government paid my way into an independent school (the Assisted Places scheme) and I had fees paid and a maintenance grant for university. I also gained some forms of cultural capital via education and leisure, but had no social or economic capital to speak of. Everyone else in my family left school at the school leaving age - my mum did return to education and move into teaching while I was a kid – and we knew no-one who had done any different, or lived anywhere else. My university cohort, by and large, could return to affluent homes in London and the Home Counties, could stay with their parents, find a job and begin a career. I slept on floors and sofas, living out of a rucksack, when I arrived in London, and like many others took the first work that could pay the rent. It took seven years and another degree to get a first job in the kind of work I’d wanted when I graduated: for others, connections or the possibility of working for free in an internship quickly opened doors that I had to keep knocking at. Indeed, it was only because I’d spent years earning in a retail job that I could afford to do the internship at the age of 28. And of course, this late start also impacts on that next stage of economic accumulation. It’s easier to save with a well-paying job, especially if you can live rent free. And even in the 90s and 2000s, the bank of mum and dad was available to the more privileged. Others inherited from grandparents, but mine were all in social housing before they died (young, of industrial diseases). Thus, while the data show that working-class graduates hailing from the north earn substantially less than middle-class graduates who grew up in London, there’s an additional head start with accumulating resources that provide for long-term stability and a safety net: we should also be measuring wealth in this way. As time goes on there become other lucky breaks to consider. In academia, where I work now, it’s the permanent job, promotion to professor, or research fellowship that play this role. Not for nothing is such progression called ‘getting ahead’. Two lecturers can be appointed at the same time, with equivalent talents and dispositions, but if one gets the three-year fellowship they are suddenly catapulted ahead. At year four of this timeline, one lecturer has had 12 months of research time, while the other has had 36, and so at the next application, the latter is valued far higher as it’s research that counts. Thus, success in the future is predicated on success in the past, despite the line between success and failure being wafer thin. And so it goes on. Those with privilege disproportionately get the lucky breaks, and so privilege is reproduced. As with my previous post, the greater the degree of inequality, the more entrenched this becomes. That house my childhood bedroom was in was worth a quarter of the national average, and so about a 10th of the London average. No amount of cutting back on other stuff (‘sacrifices’) can bridge this gap, so it is next to impossible for someone living in working-class Stoke to think it is possible to live at the heart of the country. In the past, when differentials were lower (the early 90s, say), those with more income and wealth would have had it easier, but at least it was possible for me to live in the same city as them. This, then, can be boiled down to two components. First, the difference in family or background wealth (starting point), high income inequality (producing very different speeds of accumulation) combine to make wealth, and capitals more general, far more unequal than mere income. See Killewald et al. for a broad brush look at this. Second, when wealth inequality gets wider, it becomes more difficult to bridge the gap. Investment, whether it be forgone income, paying for education, or making a expensive move to the big city, requires a sizable chunk of capital: wider wealth inequality can make this simply out of reach. Talk of housing or career ladders is problematic once some of the rungs are removed. As part of the Extinction Rebellion event, Emma Thompson joined the protest, spoke to the media from XR’s pink boat, and this week defended herself from charges of hypocrisy, having flown from LA to London to do so. On Radio 4’s Today Programme, she argued that we’re all guilty of some hypocrisy – and when we consider that most if not all the listeners will have environmental footprints bigger than the global average, I guess she’s right – and then that ‘We should all fly less. We’re all going to have to fly less.’ (Evening Standard 25 April). It’s this that I want to focus on, as it prompts a question of what this would mean, how this relates to individual and international justice, and then onto what form of equality we want. It takes me back to an argument I was having with a friend back in 2005: does addressing poverty imply redistribution from rich to poor, or keeping the share of the cake the same while the size of the cake is growing?
I don’t know how far, or how many times Emma Thompson flies each year. I assume it’s a great deal more than me, and I fly more than many in the UK and more than most in the world… I also assume she flies less than some others too. Using data from the UK in 2014, we know the distribution is skewed: 52% of adults had taken no flights, 22% had done one trip by air, 11% had done 2, 5% had done 3, and 10% had made 4 or more trips. 70% of all trips were made by the last 15% (DfT 2014). Let’s assume Emma made 20, and for arguments sake we’ll assume that all flights are equally far. We can also assume that at least some of that first 52% do sometimes fly, just not every year. So if ‘we’re all going to have to fly less’, what would this mean? I presume that the overall aim is less total flying (so less carbon emissions). This could be achieved by the same reduction to everybody: that is, each person taking one flight a year less (a). Or perhaps by a proportional reduction, with each taking 25% fewer trips (b). Or those flying most often reducing their flights more than that of those who fly least (c). Obviously, for option a, people can’t take fewer flights if they don’t take any now, and those who take one a year would then be prohibited from flying at all. Option b would require Emma losing five trips a year, but someone who flies once a year being reduced to a foreign holiday three years from four. It’s hard to see how either of these can be justified: the 85% who take two trips or fewer can ask why they should be limited when some others have far more. And this, in essence, is the question we must ask when it comes to both emissions and material inequalities in general. We cannot tell China (in aggregate) that they should have lower emissions per capita, when Western emissions are far higher. In the long run, the population of the world (in aggregate, ignoring preferences) want what we have, that is a quality of life that includes cars, technology, good food and housing, and the middle-class lifestyle takes up resources that are finite. This, though, is also the problem with addressing poverty by growing the cake as opposed to making the slices more equal. Whether we look at the UK, or the globe, it’s the case that the growing of the cake means that a lower percentage of people are going to die of malnutrition now than they did before (see Rosling’s Factfulness). However, as the sum total of stuff, resources, ‘commodity bundles’ or perhaps ‘wellbeing’ and ‘utility’ grows, the expectations of what is reasonable and fair also increases. The problems with that cake analogy is that, at any one time, the size of the cake is finite and we must ask how justifiable it is that some people have far bigger slices than others. Drawing on Anne Philips’ work on egalitarianism, this is not to be dismissed as the politics of envy, or differences generated by choice such that the artist chooses time to paint as more important than money. If the differences created by choices, dispositions and capabilities were small they would matter less. In a society (or even world) where the difference between rich and poor were small, then the person choosing to be a frequent flier would be giving up something else, like the big house in a nice neighbourhood or a luxury car. With the levels of inequality we do have, however, we instead have 15% of people who take 3 flying trips a year, and have nice homes, cars and so on, while some others take no flights, own no homes or cars: perhaps one way to see this is in the vastly different environmental footprints between the rich and the poor, and equalisation of these is a route to a more just society. Hearing Jim Al-Khalili being interviewed about his own life this morning reminded me to finish this. He began by talking about his upbringing in Iraq, with an English mother and Iraqi father, and speaking English at home, and then toning down his RP accent when he came to the UK in ’79, as a refugee from Saddam Hussein. Still, if it were now, he may well have been noted as EAL by the school…
Take my friends, J and G. Neither speaks English as a first language, one is from the Americas and the other is from the Middle East. Being bright and ambitious, they had the opportunity to pursue academic study in an English-speaking institution, married, became academics, moved to the UK and then had children. These children are trilingual, but you can probably guess which they speak most of, given that the parents also have English in common. Or another friend, D who is English, and her partner, who is from one of those ex-Empire places where a local language is present, but there’s some officialdom done in English, and elites that use English. Their children have also been in the UK since birth. Another family, arriving in the UK as students, learnt to operate in English in high level jobs, but still speaking Urdu at home, then had a child who went to the local nursery and then to primary school. Each of these children is noted as an ‘English as Additional Language’ pupil, in school returns and assessments. None of them, however, have any trouble with their English. Like the category of Pupil Premium (or Free School Meals), the administrative category is a crude measure of the extra barriers a child may have, and consequently a crude measure of additional assistance they might need. None of the children above need extra help, whereas a child who arrives alone aged 14, seeking asylum and with little English, is going to need a whole lot of help (for more than one reason). The problem here is that schools have a double incentive to make the category inclusive. First, there’s any funding associated with the EAL tag: it’s not a lot, but all money counts. More important, though, is the assessment of schools through various attainment or progress statistics. The aim, from government and via Ofsted, is to ensure children with EAL don’t fall behind and stay behind, and so schools get feedback on the difference between the EAL cohort and the others (presented in various aggregate formats). A school does well if the EAL cohort gets similar SATS grades to the other kids, and this is highly likely if a good proportion of those with an EAL tag are the children of professionals with better English (especially re. vocabulary) than many native speakers. Indeed, we know that the vocabulary of the most deprived children is much lower than that of better off children, and that vocab aged 5 is the best predictor of whether deprived children can ‘buck the trend’ and eventually escape poverty (Blanden 2006). This suggests that some of those kids who don’t get a great deal of communication may well have similar problems, even if parents are native speakers, and this is why we have Pupil Premium. I think there is an argument for rolling the two together. Like Pupil Premium, then, EAL statistics should be taken with a pinch of salt. Some schools think it gives others an unfair advantage in the data, as some pupils are noted as unlikely to do well and then their (actually likely) success bumps them up. But there will be other schools, for one reason or another, who will get a cohort of EAL children with far bigger problems, and they will be below average on this particular measure. Few of these statistics come with the kind of comparison that really helps (see EEF for an exception): not only does the kind of EAL matter, but also any other barriers that are also present. I haven’t seen any research that matches each EAL child to an equivalent with the same other problems and attributes (e.g. social background, learning difficulties, school type) AND distinguishes between the level of the EAL barrier too. And, of course, what the statistics have never shown is what would happen if the EAL assistance wasn’t there. That said, in this instance schools are likely to direct help where it is most needed. If a child tagged EAL doesn’t need help anymore (or never did) it is holding them back to insist on language lessons. Presumably, this is also the case for Pupil Premium, but because the funding is ring-fenced (see Allen 2018), it creates an incentive for doing extra work with children who don’t need it, while restricting how much can be done for those who do. Discussions about the ‘white working class’ come and go, and being part of (or, at least from) that demographic I take an interest especially when they becomes culturalist and start to blame people for their own misfortune/failure. The debate about schooling, seemingly about whether ‘white working class boys’ (me again) are at the bottom of the pile, is ripe for some rethinking that takes in process and a critical realist take on causation. Counterintuitive it may at first appear, but it is to be expected that if:
I recently had the pleasure of hearing David Gillborn speak, and was reminded once again of the slippage in a lot of talk of the white working class and academic underachievement. Two parts are important here. First, we should note how some of this debate posits ‘white working class’ as an ethnicity, which could usefully be compared to all black Britons, as opposed to ‘black working class’. Regardless of how we want to think the status of ethnicity and culture – and I find these concepts problematic for such work because of their fuzziness and their not being a straightforward causal independent variable – this approach doesn’t help us untangle the various constituent parts. Second, we should also note that FSM status is not the same as ‘working class’, but is an administrative status with specific causes. This, however, made me think about the problems of comparing even the free school meal cohorts that are noted as, on the one hand ‘white’, and on the other ‘BME’ or any subgroups. After all, for any robust comparison we should be looking at samples that differ only according by white v BME, or only FSM v non-FSM, and that’s something we can’t be sure of. Indeed, there are good reasons for believing that they are not. In this particular case, it only takes a racist employment environment to make these FSM groups not properly comparable. There are complications we could add to this – thinking about who migrates, for instance – but these are unnecessary. What we are studying, in these comparisons, is groups of pupils that are sorted by a prior process, that is the way that some pupils get FSM and some do not. To get free school meals, a family has to have a low income. Indeed, under the Universal Credit system it will be less than £7400 per year after tax, before benefits. In essence, you can get FSM if income is so low that the state is making a benefit payment due to having a lower income than it believes people can live on. Now remember that unemployment rates are higher for BME people, even if they are graduates. Sadly, this data lumps all BME people together, while in reality there are differences across the groups, but this is enough for this argument. This racism in the employment system means (all other things being equal) that the parental background of BME free school meals will be skewed towards a slightly better educated cohort. A higher proportion of those in a ‘BME unemployed’ group will be graduates than is the case in the white unemployed group. Therefore, if the education of parents has any influence (through whatever mechanism) on how well kids do at school, then the overrepresentation of graduates in the unemployed BME parents means that it is to be expected that their cohort of kids will have better results than that of the unemployed white parents. Indeed, given that one named route to FSM is that of asylum seeker benefits (support under Part VI of the Immigration and Asylum Act 1999) and many seeking asylum are highly educated but not allowed to work, then this relationship will be even stronger. Of course, what this approach also suggests is more thinking not only about the process of who is in the free school meals cohort, but also what might cause them to do worse at school, and so what can be done about it. This can go hand-in-hand with thinking about why other groups do worse at school too: it’s pointed out in the official statistics that ‘the Gypsy/Roma ethnic group had the lowest percentage of pupils achieving A* to C in English and Maths GCSE (10% did so)’ but looking at the tables you find that FSM/non-FSM makes little difference here. Apart from in that case, FSM seems to always make a big difference in a negative direction, and makes most difference for White Irish pupils. Apart from Irish travellers/Roma/Gypsy, it’s the Black Caribbean cohort that has the lowest percentage. What I find most disheartening about the public debate on this is that these ‘social facts’ are then taken as read, with the combination of ethnic identity, alongside FSM or class, given a more or less causal status that can be responded to as is. As in much work on extremism, the area I normally work on, this approach sometimes end up saying it’s about ‘their’ culture. Most obviously, if it is just about culture then why do many pupils still succeed despite being members of these cohorts. Those gaps described above are cohort figures, not individuals. As Becky Allen writes about the Pupil Premium – the extra per-pupil funding schools get alongside the free school meals – the targeting is crude because it uses the demographic indicators as opposed to checking who has more barriers to education and what they are. There is plenty of research on this, and a long list of factors including: parents that are not engaged with education because of their own experience; drugs and alcohol issues; a lack of settling because of school moves; poverty that makes getting to school with the right kit harder; teachers with low expectations of particular pupils; other priorities; assumptions that education isn’t needed for the expected job; and so on and so on. Perhaps it is time to reread Paul Willis’ Learning to Labour. None of these factors are about ‘whiteness’, ‘working classness’, ‘blackness’ per se. A large part of the real story is that the pupils whose parents (for whatever reason) don’t invest as much in education tend to do less well. This is something we can address by identifying this, and working on it… Becky Allen’s approach is even more specific: ‘Categorising students as a means of allocating resources in schools is very sensible, if done along educationally meaningful lines (e.g. the group who do not read at home with their parents; the group who cannot write fluently; the group who are frequently late to school)’ |
